
San Diego's property market is defined by structural scarcity, not cyclical swings. Nearly every factor that separates this city from Phoenix, Austin, or Las Vegas traces back to one reality: San Diego is 95% developed, leaving almost no vacant land for outward expansion. That physical constraint, combined with rental occupancy at 97% and a permitting pace that falls well short of demand, creates pricing pressure that does not reset the way it does in cities with room to build outward. For buyers, sellers, and investors, understanding why San Diego housing prices rise requires looking at geography, policy, and construction data together.
Why the San Diego property market differs from other cities
San Diego's core market distinction is structural scarcity driven by geographic and regulatory limits, not temporary imbalances. Cities like Riverside, Sacramento, or Las Vegas can absorb population growth by expanding their footprints into surrounding desert or farmland. San Diego cannot. The Pacific Ocean sits to the west, the U.S.-Mexico border to the south, Camp Pendleton to the north, and the Cleveland National Forest to the east. The city is physically boxed in, and that boundary is permanent.
This is not a new observation, but its implications are consistently underestimated by buyers relocating from other markets. When a city like Austin adds 50,000 residents, developers break ground on new subdivisions within months. When San Diego adds 50,000 residents, the housing response is measured in infill permits, accessory dwelling units (ADUs), and multi-family conversions on existing lots. The timelines are longer, the unit counts are smaller, and the price relief is slower.
The result is a market where supply consistently lags demand, and that gap does not close the way it does elsewhere. Buyers competing for limited inventory in La Jolla or Rancho Santa Fe are not competing against a temporary shortage. They are competing against a structural condition that has been decades in the making.
How land scarcity shapes San Diego's housing supply
San Diego's near-full development means that virtually all new housing must come from infill projects, ADU additions, and the redevelopment of underutilized parcels. This is a fundamentally different supply mechanism than greenfield development, and it carries distinct risks and timelines.
Infill projects require navigating existing infrastructure, neighboring property rights, and complex entitlement processes. A developer building a 20-unit apartment building in North Park faces a permitting timeline that can stretch 18 to 36 months before a single foundation is poured. In contrast, a developer building a 200-unit subdivision outside Phoenix might break ground within six months of acquiring land.
California's ADU laws have helped by allowing homeowners to add units on existing lots, but the impact is incremental. ADUs add one or two units per parcel, not the hundreds that a single suburban subdivision delivers. The cumulative effect matters over time, but it does not move the needle fast enough to offset population-driven demand.
Key supply constraints that separate San Diego from expansion-capable cities:
- Geographic boundaries on all four sides eliminate greenfield development as a meaningful option
- Permitting delays add months or years to project timelines compared to inland California or Sun Belt cities
- Entitlement risk on infill sites discourages smaller developers who lack capital to absorb delays
- ADU growth adds units incrementally but cannot replicate the volume of subdivision-scale construction
Pro Tip: If you are evaluating a property in a San Diego neighborhood with active ADU construction nearby, treat that activity as a supply signal. It means the area is absorbing demand through the only mechanism available, which typically supports rather than depresses values.
How does San Diego's construction rate compare to other cities?
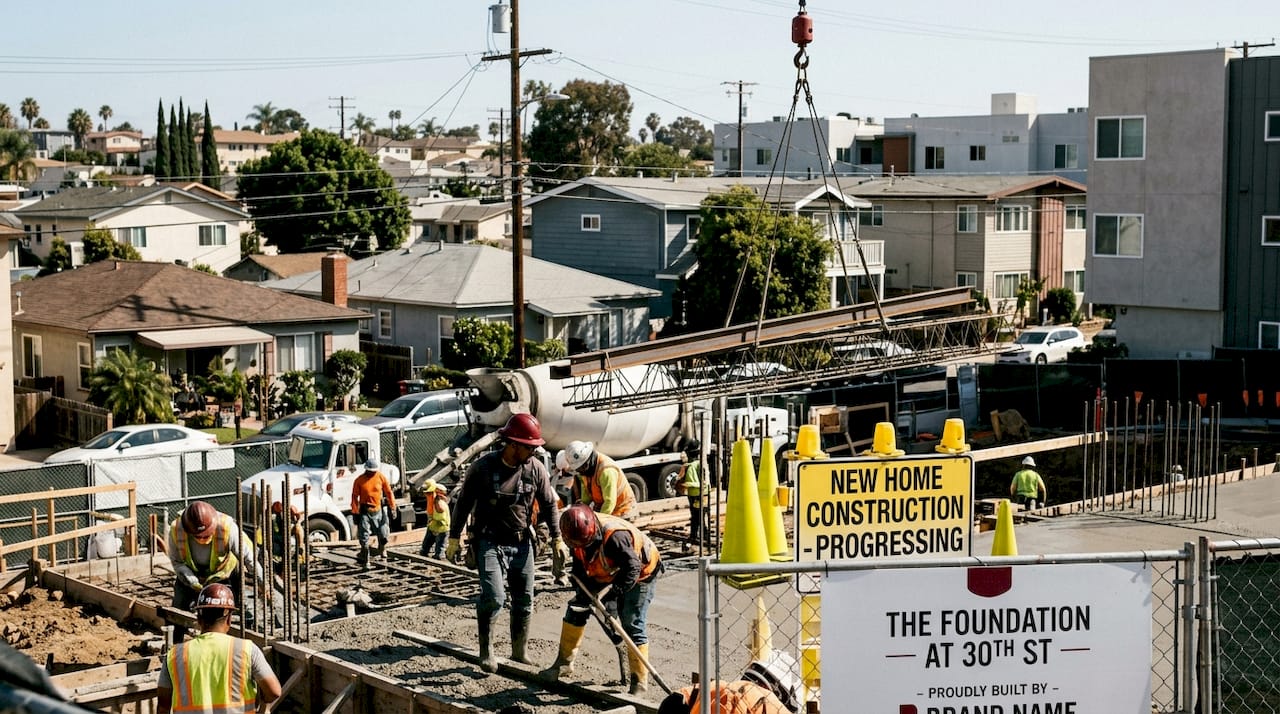
The numbers make the supply gap concrete. Between 2022 and 2025, San Diego built roughly 3 housing units for every 4 residents added, falling below California's statewide average of one unit per new resident. San Diego city added approximately 22,000 new housing units during that period, representing about two-thirds of the countywide total.
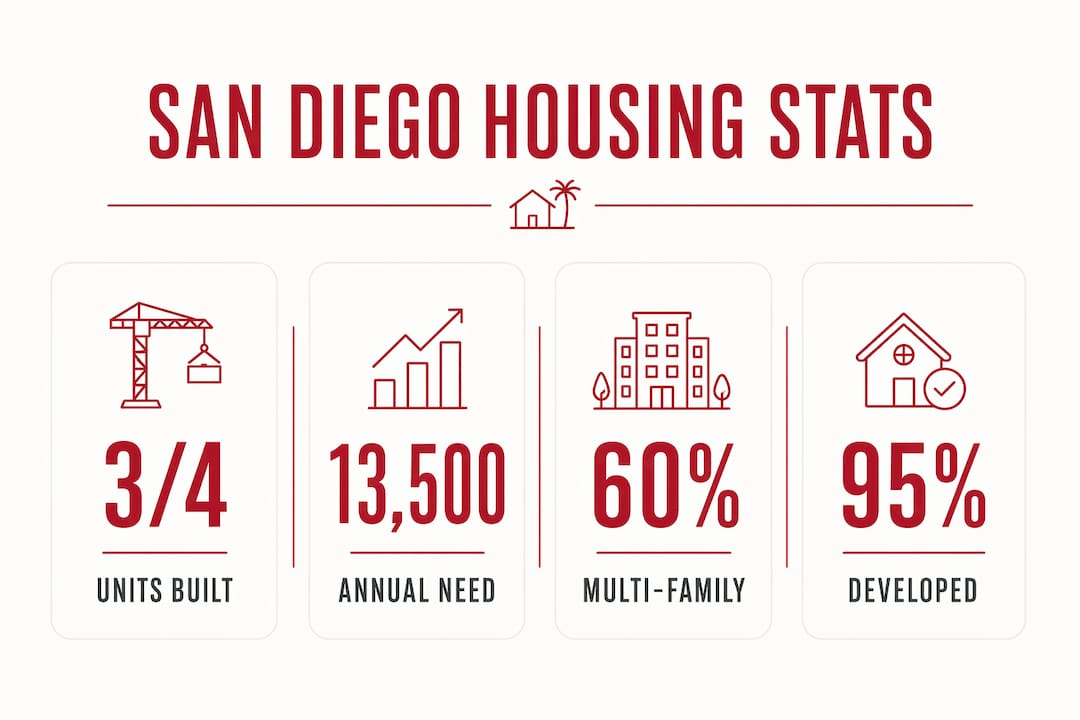
To put that in perspective, the city needs approximately 13,500 new homes annually to meet its target of 108,000 homes by the end of the decade. Current permitting covers roughly two-thirds of that figure. That shortfall compounds each year, widening the gap between available supply and the households competing for it.
| Metric | San Diego | California average | Inland counties (e.g., Riverside) |
|---|---|---|---|
| Housing units per new resident (2022–2025) | 0.75 | 1.0 | Above 1.0 |
| Share of new units: multi-family | 60% | 43% | Under 13% |
| Annual units needed vs. permitted | ~13,500 needed / ~9,000 built | Closer to parity | Surplus in some years |
| Primary growth mechanism | Infill and ADUs | Mixed | Greenfield subdivision |
Inland counties like Riverside tell the opposite story. Single-family subdivisions dominate their new construction mix, and they regularly build at or above population growth rates. That difference in construction capacity directly explains why differences in property values between San Diego and its inland neighbors have widened over the past decade, not narrowed.
What role do policy and rental dynamics play in San Diego's prices?
Rental market tightness is the demand-side engine that keeps San Diego's pricing elevated even when construction activity slows. With rental supply at 97% occupancy in early 2026, renters facing lease renewals have almost no negotiating power and limited alternatives. That pressure pushes more households toward ownership, which competes directly with investor and move-up buyer demand.
San Diego's rent surge of approximately 45% between 2017 and 2023 attracted significant construction capital during that period, producing a wave of multi-family permits. The post-2023 rent plateau has since slowed permitting activity, and analysts predict reduced future deliveries compared to the recent peak years. This boom-and-lag cycle is more pronounced in San Diego than in cities where construction responds faster to demand signals.
Policy is now entering the equation in ways that have no parallel in most U.S. cities. Key policy factors currently shaping San Diego's market:
- Measure A proposes taxing vacant second homes unoccupied for more than half the year, targeting between 1,541 and 2,826 empty units that could return to the rental or sales market
- Bonus density programs concentrate new affordable housing in low-resource neighborhoods, which reinforces historic segregation patterns and limits equitable supply distribution
- ADU incentive programs at the state and city level reduce permitting fees and streamline approvals for backyard units
No comparable vacancy tax mechanism exists in Phoenix, Dallas, or Denver. If Measure A passes, it represents a policy experiment that could influence how other constrained coastal cities approach supply recovery.
How San Diego's housing mix differs from other regions
San Diego County's new housing skews heavily toward multi-family construction. Roughly 60% of new units built between 2022 and 2025 were in multi-family projects, compared to 43% statewide and under 13% in some inland counties. That difference shapes the investment environment in ways that matter to buyers and investors alike.
Multi-family infill development targets middle-market renters rather than luxury buyers. A 30-unit apartment building in City Heights or North Park does not compete with a single-family home in La Jolla or Coronado. The two product types serve different demand pools, which means new construction in San Diego does not provide the same price relief at the ownership level that new single-family subdivisions deliver in Riverside or Temecula.
For investors, this mix creates a bifurcated opportunity set. Multi-family assets in transit-adjacent neighborhoods benefit from persistent rental demand and limited competing supply. Single-family and luxury properties in coastal neighborhoods operate in a near-zero-new-supply environment, where global buyers continue to drive demand independent of local construction cycles. Understanding which segment you are buying into is the first analytical step any serious investor should take before entering this market.
Key takeaways
San Diego's property market is structurally constrained by geography, construction capacity, and policy in ways that no cyclical correction will resolve.
| Point | Details |
|---|---|
| Geographic limits are permanent | San Diego's four-sided boundary eliminates outward expansion as a supply solution. |
| Construction lags population growth | San Diego built 0.75 units per new resident from 2022 to 2025, below the California average. |
| Rental tightness sustains price pressure | At 97% occupancy, rental demand mechanically supports ownership prices across the market. |
| Multi-family dominates new supply | 60% of new units are multi-family, which does not relieve single-family or luxury price pressure. |
| Policy is actively reshaping supply | Measure A and ADU programs represent supply interventions with no equivalent in most U.S. cities. |
What 15 years in this market actually taught me
Most buyers arrive in San Diego expecting the market to behave like the one they left. They wait for a correction, watch inventory, and assume that rising rates will eventually create a buying window. Sometimes that window opens briefly. But the structural floor here does not disappear the way it does in Dallas or Denver, because the supply mechanism is fundamentally different.
The investors I have seen succeed in San Diego are the ones who stopped waiting for the market to normalize and started working with its constraints. They buy in neighborhoods where ADU potential adds a second income stream. They target properties where the land value alone justifies the purchase price. They understand that in a city where permitting barely covers two-thirds of demand, holding a well-located asset is almost always the right long-term position.
The one mistake I see repeatedly is buyers conflating a price plateau with a buying opportunity in the wrong segment. A slowdown in luxury condo sales in downtown San Diego does not mean coastal single-family homes in La Jolla are softening. These are different markets with different supply profiles, and treating them as one leads to poor timing decisions. Read the SoCal market trends alongside local data, but always weight the neighborhood-level supply picture most heavily.
— Stu
Work with Stuharveyestates in San Diego's unique market
San Diego's structural constraints make local expertise more valuable here than in almost any other U.S. city. Generic market advice does not account for the neighborhood-level supply differences that separate a strong investment from a stagnant one.
Stuharveyestates brings more than 15 years of San Diego real estate experience and over $1.2 billion in completed transactions to every client engagement. Whether you are buying a first property in a supply-constrained coastal neighborhood, selling into a market shaped by persistent demand, or evaluating an investment in San Diego's multi-family or luxury segments, the team provides analysis grounded in real transaction data. Start your search with San Diego property listings and get advice built around the market's actual dynamics, not national averages.
FAQ
Why is San Diego housing so expensive compared to other cities?
San Diego is nearly 95% developed, which eliminates outward expansion and forces all new supply through slow infill and ADU processes. Combined with rental occupancy at 97% and construction that covers only two-thirds of annual demand, price pressure is structural rather than cyclical.
How does San Diego's housing construction compare to California?
Between 2022 and 2025, San Diego built approximately 0.75 housing units per new resident, below California's statewide average of 1.0. The city needs roughly 13,500 new homes per year to meet its decade-end target but currently permits around 9,000.
What is Measure A and how does it affect San Diego's property market?
Measure A proposes taxing vacant second homes unoccupied for more than half the year, which could return between 1,541 and 2,826 units to the market. No equivalent policy exists in most U.S. cities, making it a distinctive supply intervention specific to San Diego.
How does San Diego's housing mix differ from inland California?
Roughly 60% of San Diego County's new housing units are multi-family, compared to 43% statewide and under 13% in some inland counties like Riverside. Inland regions build primarily single-family subdivisions on greenfield land, a supply model San Diego cannot replicate.
Does new construction in San Diego lower home prices?
New construction in San Diego targets middle-market renters through multi-family infill and does not meaningfully increase single-family or luxury supply. This means new units do not provide the same ownership-level price relief that large-scale subdivision construction delivers in expansion-capable cities.