
Luxury rentals can generate positive cash flow, but only when net-to-owner income clears your debt service after accounting for management fees, insurance, turnover, and reserves that run materially higher than mid-range properties. The gap between gross revenue and what actually lands in your account is where most investors get surprised.
Quick conditions that make a luxury rental more likely to cash flow:
- Market occupancy above 55% for short-term, or a verified corporate/long-term tenant pipeline
- ADR resilience confirmed by a real comparable set, not a single headline figure
- Operating costs modeled at a higher percentage of gross revenue than standard rentals
- Financing structured with a DSCR above 1.20 at base-case occupancy
- Furnished decision made before underwriting, since furnishing amortization changes net-to-owner materially
AirROI's Q2 2026 analysis found luxury short-term listings generate 2.2–4.7x more gross revenue than mid-range listings, but acquisition costs and operating expenses scale faster. That spread is the central tension every investor needs to resolve before committing capital. Stu Harvey Estates, operating through The Oppenheim Group across San Diego, Los Angeles, and Orange County, builds pro-forma ranges around five core metrics to determine whether a specific property actually clears that bar.
Table of Contents
- How do you model luxury rental property cash flow accurately?
- Which operating costs hit hardest in luxury rentals?
- What yield metrics should luxury investors actually track?
- How does submarket choice change your net yield?
- How do financing, reserves, and taxes change your cash flow?
- What do downside, base, and upside scenarios look like?
- What questions should you ask property managers and insurers?
- How Stu Harvey Estates helps you underwrite cash-flowing luxury rentals
- Key Takeaways
- Why underwriting is the only part of luxury investing that actually matters
- Selected sources and further reading
How do you model luxury rental property cash flow accurately?
OmniVillas' owner earnings framework identifies five driver numbers that connect gross revenue to net owner income: average daily rate (ADR), occupancy rate, booked nights, average length of stay (ALOS), and net owner payout. Model each as a range, not a point estimate.
Modeling steps:
- Pull a real comparable set: at least 8–12 active listings within 1 mile, same bedroom count, similar amenity tier. Use AirDNA or direct manager data.
- Set ADR ranges: low (shoulder season), base (expected average), and high (peak/event weeks). Apply seasonal multipliers.
- Set occupancy assumptions: downside (45%), base (60%), upside (75%). Never use a manager's best-year figure as your base.
- Estimate every operating cost line individually (see Section 3 below).
- Calculate net-to-owner: Gross Revenue minus channel fees, cleaning, management, maintenance, insurance, reserves, and furnishing amortization.
Sample pro-forma (3-bedroom coastal luxury, $1.2M purchase):
| Line Item | Downside | Base | Upside |
|---|---|---|---|
| Net-to-owner | — | $85,496 | $142,722 |

Modeling a range rather than one headline number using a real comparable set is the single most important discipline in luxury underwriting. A single projected revenue figure from a listing broker is not a pro-forma.
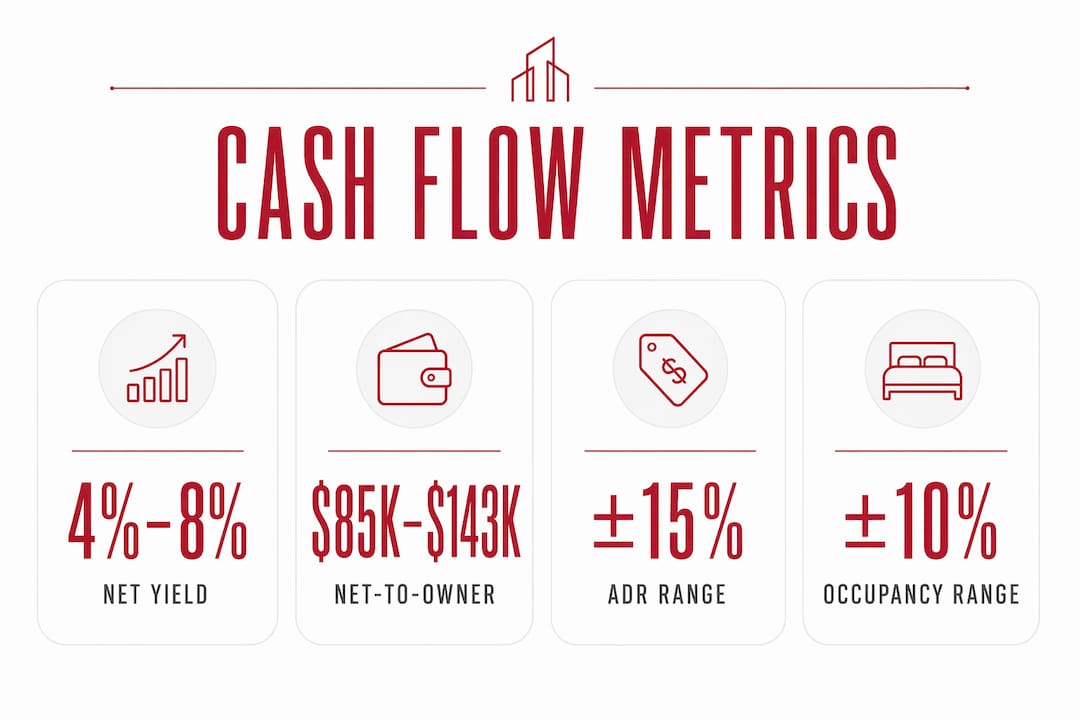
Pro Tip: Build your sensitivity table in a spreadsheet: vary ADR by ±15% and occupancy by ±10 percentage points simultaneously. The resulting matrix shows you exactly which combinations produce positive cash flow after debt service, and which don't.
Which operating costs hit hardest in luxury rentals?
Luxury rental operating costs consume a higher share of gross revenue than standard rentals because of premium maintenance, concierge coordination, and periodic aesthetic refreshes. These are not one-time costs; treat them as persistent fixed and semi-fixed lines.
Major cost lines and what to expect:
- Property management: Management fees for luxury short-term rentals are much higher than for standard properties due to concierge coordination and premium vendor networks. NextGen Coastal's 2026 Malibu portfolio cites an example fee of 5.9% for one property, but full-service luxury managers in coastal markets commonly charge between 20% and 30% of gross revenue. Confirm the exact scope of service before comparing percentages.
- Cleaning and turnover: Per-turn costs for luxury properties run materially higher than mid-range due to longer checklists, specialty surface care, and linen programs. Budget per-turn rather than monthly.
- Insurance: Wildfire exposure, flood zones, and umbrella liability push luxury coastal premiums well above standard. NextGen Coastal's Malibu analysis flags insurance cost pressure as a primary driver of net-yield compression for oceanfront estates.
- Furnishing amortization: A fully furnished luxury property requires periodic refresh cycles. Budget a dedicated annual amortization line, not a lump-sum guess.
- Utilities and landscaping: Pool heating, smart-home systems, and curated landscaping add fixed monthly costs regardless of occupancy.
- Platform and channel fees: Typically 12–15% of gross booking value across Airbnb, Vrbo, and direct channels combined.
Understanding luxury concierge service expectations helps investors anticipate which vendor relationships drive recurring cost and where markup risk hides.
Red flag: Sellers and listing brokers routinely understate cleaning, maintenance, and insurance in their pro-formas. Ask for 24 months of actual expense receipts, not projected figures.
What yield metrics should luxury investors actually track?
Core metric formulas:
- Gross Revenue = Booked Nights × ADR
- NOI (Net Operating Income) = Gross Revenue minus all operating expenses (excluding debt service)
- Net Yield = NOI ÷ Purchase Price
- Cap Rate = NOI ÷ Purchase Price (same formula; "cap rate" is the market convention for unleveraged return)
- Cash-on-Cash Return = Annual Cash Flow After Debt Service ÷ Total Cash Invested
- DSCR = NOI ÷ Annual Debt Service (lenders typically require ≥1.20–1.25 for investment properties)
AirROI's 2026 data confirms that luxury RevPAR and ADR premiums remain large in many resort markets, but occupancy resilience determines whether luxury yields beat mid-range on net income. A property with a 4.7x ADR premium but 40% occupancy can underperform a mid-range asset at 70% occupancy on net yield.
Realistic luxury benchmark ranges (U.S. coastal markets, 2026):
| Metric | Typical Range | Notes |
|---|---|---|
| Net Yield | 4%–8% | Varies sharply by submarket and financing |
| Cap Rate | 4%–7% | Unleveraged; oceanfront often compresses to low end |
| Cash-on-Cash | 6%–12% | Leverage-dependent; requires DSCR ≥1.20 |
| DSCR (base case) | 1.10–1.40 | Below 1.10 signals occupancy risk |
Cash-on-cash return and net-to-owner after debt service are the decisive metrics for income-focused investors. Cap rate tells you the unleveraged story; cash-on-cash tells you whether the deal works with your actual loan.
How does submarket choice change your net yield?
Location bifurcation is real and measurable. NextGen Coastal's 2026 Malibu analysis shows hillside luxury contemporaries can achieve higher net yields than oceanfront estates once insurance cost pressure and occupancy differences are factored in. Oceanfront properties command premium ADR, but wildfire and flood insurance premiums, combined with stricter short-term rental regulations in some coastal zones, compress net yield to the low end of the benchmark range.
Practical rules of thumb for submarket screening:
- Hillside or canyon luxury properties in coastal markets often carry lower insurance costs and fewer regulatory restrictions than beachfront parcels, improving net yield even at slightly lower ADR.
- Resort markets with event-driven demand (music festivals, golf tournaments, film festivals) can spike occupancy to 90%+ during peak weeks, but shoulder-season occupancy can drop below 40%. Model the full annual distribution, not peak weeks.
- Metro luxury markets like Atlanta's Buckhead corridor offer more attractive price-to-rent ratios and long-term corporate lease options that reduce operating burdens versus short-term models.
San Diego's 2026 luxury market shows demand concentrated in lifestyle-driven submarkets like La Jolla and Rancho Santa Fe, where occupancy resilience is stronger than in purely seasonal beach corridors.
How do financing, reserves, and taxes change your cash flow?
Financing structure is often the variable that makes or breaks luxury rental cash flow. A 30% down payment at current rates produces a very different DSCR than a 40% down payment, and lenders increasingly use DSCR underwriting for investment properties rather than personal income qualification.
Key financing and tax levers:
- Low leverage (40%+ down): Improves DSCR and cash-on-cash at base-case occupancy; reduces break-even booked nights.
- High leverage (20–25% down): Amplifies cash-on-cash in upside scenarios but creates negative cash flow risk if occupancy falls below break-even.
- Depreciation: Residential rental property depreciates over 27.5 years under IRS rules. On a $1.2M property, that's roughly $43,600 in annual paper depreciation that offsets taxable rental income.
- Cost segregation: An engineering-based cost segregation study can accelerate depreciation on personal property components (appliances, fixtures, landscaping) into 5- and 15-year schedules, improving early-year tax cash flow materially.
- Schedule E reporting: All rental income and expenses flow through Schedule E. Accurate, tax-ready expense logs are not optional; they determine your actual after-tax return.
- Operational reserves: Budget 8–12% of gross revenue as a dedicated reserve for luxury properties, sized for premium repair costs and seasonal vacancy gaps.
Use a DSCR calculator to test how different loan terms shift your break-even occupancy before committing to a financing structure.
Pro Tip: Cost segregation studies typically cost $5,000–$15,000 but can accelerate tens of thousands in depreciation deductions into year one. For a luxury rental above $1M, the math almost always favors commissioning one. Consult a CPA before acting.
This section is general information, not tax or legal advice. Confirm current IRS rules and your specific situation with a qualified CPA.
What do downside, base, and upside scenarios look like?
Three scenarios force you to identify which variable drives failure. For luxury rentals, the answer is almost always occupancy, not ADR.
Three-scenario framework (same 3-bedroom coastal property):
| Scenario | ADR | Occupancy | Gross Revenue | Total Costs | Net-to-Owner |
|---|---|---|---|---|---|
| Downside | — | 45% (— nights) | — | $62,452 | $44,148 |
| Base | — | 60% (— nights) | — | $89,704 | $85,496 |
| Upside | — | 75% (— nights) | — | $124,428 | $142,722 |
Break-even occupancy formula:
Break-Even Nights = (Fixed Annual Costs + Debt Service) ÷ (ADR minus Variable Cost Per Night)
Steps to stress-test your model:
- Set fixed costs (insurance, management minimum, reserves, furnishing amortization, utilities) as constants.
- Calculate variable cost per booked night (cleaning, channel fee, consumables).
- Plug in your annual debt service.
- Solve for the booked-night count that produces zero net cash flow.
- Compare that break-even to your downside occupancy assumption. If break-even exceeds your downside, the deal has no margin of safety.
Dynamic seasonal pricing, layering summer premiums and shoulder-season discounts, typically outperforms static monthly pricing in seasonal luxury markets. Build seasonal ADR multipliers into your model rather than using a flat annual average.
What questions should you ask property managers and insurers?
Questions for property managers:
- What is your exact fee structure, and does it include or exclude cleaning, channel fees, and vendor coordination?
- Do you mark up vendor invoices? If so, by what percentage?
- What is your reporting cadence, and can you provide a sample P&L from a comparable home you currently manage?
- How do you handle regulatory compliance and short-term rental permit renewals?
- What is your average occupancy rate across your luxury portfolio over the past 24 months?
Red flags to watch for:
- A single headline annual revenue projection with no range or comparable set
- Opaque vendor markup language buried in the management agreement
- Reserve recommendations below 5% of gross revenue for a luxury property
- Flat seasonal pricing with no dynamic rate strategy
- No documented experience with luxury-tier insurance claims or regulatory disputes
Documents to request during underwriting:
- 24 months of actual booking data from a comparable property in their portfolio
- Itemized expense logs for the same comparable (not estimates)
- Insurance premium history for at least two policy renewal cycles
- Copies of any active short-term rental permits or zoning variances for the target property
- References from at least two current luxury property owners they manage
You can screen and compare luxury-capable managers through a manager marketplace that lists verified operators with portfolio data.
How Stu Harvey Estates helps you underwrite cash-flowing luxury rentals
Identifying a property with real income potential requires more than a listing search.
Stu Harvey Estates builds tailored pro-forma ranges for investors evaluating luxury rental acquisitions across San Diego, Los Angeles, Orange County, and Southern California. The process starts with a property review and local comparable pull, moves to a range-based pro-forma with base, downside, and upside scenarios, then advances to an underwriting call covering financing structure, manager sourcing, and insurance benchmarking. Stu Harvey brings 15+ years of experience, 250+ completed luxury transactions, and over $1.2 billion in sales volume to every underwriting conversation, backed by The Oppenheim Group's market reach.
Browse active luxury listings or contact Stu Harvey Estates directly to request a pro-forma review for a specific property you are evaluating.
Key Takeaways
Luxury rental property cash flow is achievable, but only when net-to-owner income is modeled using five core metrics, realistic operating costs, and a DSCR above 1.20 at base-case occupancy.
| Point | Details |
|---|---|
| Model ranges, not headlines | Use downside, base, and upside scenarios across ADR and occupancy to find your true net-to-owner range. |
| Operating costs run higher | Management, insurance, cleaning, and furnishing amortization consume a larger share of gross revenue in luxury than in standard rentals. |
| Occupancy drives failure or success | ADR premiums are real, but occupancy resilience determines whether net yield beats mid-range alternatives. |
| Submarket selection changes net yield | Hillside vs. oceanfront, resort vs. metro: insurance, regulation, and seasonality shift yields significantly within the same price tier. |
| Stu Harvey Estates | Provides pro-forma range modeling, local comparables, and acquisition support for luxury rental investors across Southern California. |
Why underwriting is the only part of luxury investing that actually matters
Most investors who lose money on luxury rentals did not buy the wrong property. They bought the right property with the wrong model. They used a manager's best-year revenue projection, assumed mid-range operating cost percentages, and skipped the break-even occupancy calculation. The deal looked fine on paper because the paper was wrong.
What I look for first in any luxury rental pro-forma is the gap between gross revenue and net-to-owner at the downside scenario. If that gap is too wide to survive a soft quarter, the deal is not underwritten, it is hoped. The properties that actually perform are the ones where the downside still clears debt service, even if narrowly. Everything above that is upside, not the plan.
If you are evaluating a luxury rental and want a second set of eyes on the numbers, reach out to Stu Harvey Estates for a pro-forma review before you commit.
Selected sources and further reading
- AirROI: Luxury Airbnb Investment 2026 — Q2 2026 market data on luxury vs. mid-range RevPAR, gross revenue premiums, and operating cost differentials. Extract the revenue multiple and cost-scaling data for your pro-forma assumptions.
- OmniVillas: How much can a luxury vacation rental earn? — The clearest framework available for the five core metrics and the formulas linking gross revenue to net owner income. Use this to structure your input checklist.
- NextGen Coastal: Malibu Luxury Rental Returns 2026 — Coastal bifurcation data, management fee examples, and insurance cost analysis for a real Malibu portfolio. Essential for California coastal underwriting.
- The Luxury Realtor Group: Atlanta Luxury Rental Market — Metro luxury market context showing how price-to-rent ratios and lease type (long-term corporate vs. short-term) change underwriting outcomes outside coastal markets.
- Rental Living News: Al Barari record villa lease — An outlier trophy-market transaction (UAE jurisdiction) illustrating extreme yield potential in unique assets. Useful for understanding the upper bound of luxury lease economics, not as a U.S. benchmark.
- RedAwning: Vacation rental management fees — Practitioner guidance on why range-based modeling from comparable bookings outperforms single-figure projections. Use this to justify your modeling methodology to partners and lenders.