
Before you tour a single property, run this check: verified academic outcomes, per-pupil spending, boundary stability, campus safety, specialty programs, enrollment pressure, and community engagement. Those seven factors, checked in that order, tell you more about an upscale neighborhood's staying power than the listing photos ever will. Get these right and you've done most of the diligence that separates a smart luxury purchase from an expensive guess.
Here's the quick-scan version to keep open in a browser tab while you shop listings:
- Academic outcomes: state test proficiency, graduation rate, AP/IB participation, verified through your state's own report card.
- Per-pupil resources: how much the district spends per student and where that money actually goes.
- Boundary stability: whether the attendance zone has shifted recently or shows signs it might.
- Safety and campus environment: discipline data, security measures, incident history.
- Specialty programs: STEM tracks, arts, athletics, and whether they're funded or symbolic.
- Enrollment pressure: waitlists, portable classrooms, or overcrowding that signals capacity strain.
- Community engagement: PTA activity, fundraising totals, and volunteer turnout as a proxy for long-term investment.
Pro Tip: Check how close a property sits to a district boundary line before anything else. A home two blocks inside a top-rated zone can lose that status overnight if a redistricting vote goes the wrong way, while a home just outside it might gain access next year. Boundary-edge properties carry the highest hidden volatility of any factor on this list.
Key Takeaways
School-district quality functions as a measurable, durable driver of luxury-home value, and verifying it takes minutes with the right tools.
| Point | Details |
|---|---|
| Verify academic data directly | Check state report cards for the specific school, not just district-wide averages. |
| Confirm boundary stability | Call the district's enrollment office to ask about pending boundary studies. |
| Check multi-year budget trends | Pull three to five years of per-pupil spending, not a single year's snapshot. |
| Weigh non-academic factors | Safety measures, extracurriculars, and facility quality often matter as much as test scores. |
| Match priorities to your goal | Families should weigh program fit; investors should weigh liquidity and boundary risk. |
| Get local verification support | Stu Harvey Estates pairs property search with on-the-ground school-district due diligence across Southern California. |
Table of Contents
- Why School District Quality Matters for Upscale Buyers and Investors
- What Are the Most Reliable School Quality Indicators to Check?
- Do Non-Academic Features Matter as Much as Test Scores?
- How Do District Budgets and Staffing Affect School Quality?
- What Boundary and Enrollment Risks Should Buyers Watch For?
- How Do Charter and Private Schools Affect District Reputation?
- How Should Buyers and Investors Verify Listing Claims About Schools?
- Should You Weight These Factors Differently as a Family vs. an Investor?
- What Do the Numbers Actually Say About School-Driven Price Premiums?
- A Practitioner's View on Verifying School Quality Before You Buy
- How Stu Harvey Estates Helps You Confirm District Quality Before You Buy
- Where to Look Next for Verified School Data
- Sources
Why School District Quality Matters for Upscale Buyers and Investors
School quality drives buyer demand, price appreciation, and how fast a luxury home sells, full stop. This isn't a soft preference that shows up in survey data somewhere. It shows up directly in transaction records, and the gap between top-rated and average districts has widened enough that ignoring it is a measurable underwriting mistake.
Homes in higher-rated public school districts get notably more online views and sell faster than the national median, according to Realtor. That's not a marginal edge. Faster sales mean less carrying cost for sellers and less negotiating leverage for buyers, which is exactly why competition in these zones stays intense even when broader luxury markets cool.
The price effect is even sharper at the local level. A recent hedonic-regression study of the Alpharetta, Georgia market found that homes zoned to top-performing public high schools sold for a significant premium compared with nearly identical homes zoned to lower-ranked schools, after controlling for square footage, lot size, and age of construction (see the school quality capitalization study). Opendoor's market analysis reports typical premiums near highly rated schools averaging in the low to mid double digits, with some individual markets running considerably higher.
Three mechanisms explain the pattern. First, buyer competition intensifies in a fixed supply of homes zoned to a strong district, and that scarcity gets priced in immediately, as explained in Winning listings in a competitive real estate market. Second, school quality signals broader neighborhood investment, meaning better-funded schools tend to sit inside neighborhoods with better-maintained infrastructure and stronger civic engagement. Third, affluent neighborhoods tend to persist through economic cycles because political influence and private resources protect their access to high-quality public goods, schools chief among them. That resilience is exactly why a top-rated district functions less like a nice-to-have amenity and more like an anchoring asset that supports demand even when the broader housing market softens.
What Are the Most Reliable School Quality Indicators to Check?
Start with hard numbers before you trust anyone's opinion, including a listing agent's. The most reliable indicators, in order of how quickly they reveal a district's real strength, are: state test proficiency rates, graduation rate, AP/IB participation, college enrollment rate, student-teacher ratio, and per-pupil spending. Each one takes about five minutes to look up if you know where to go.
- State test proficiency. Every state publishes its own report card with subject-level proficiency rates by school. Search "[your state] department of education school report card" and compare the specific school, not just the district average, since averages hide weak individual campuses.
- Graduation rate. A four-year graduation rate above 95% is common in strong upscale districts. Anything meaningfully below that in a supposedly top-tier zone deserves a follow-up question about who's leaving and why.
- AP/IB participation. High participation rates (not just high pass rates) indicate the school is pushing rigor broadly rather than reserving it for a small cohort. Both numbers matter, but participation tells you about access.
- College enrollment rate. State report cards and district annual reports typically track the percentage of graduates enrolling in postsecondary programs within a year of graduation.
- Student-teacher ratio. Lower ratios generally mean more individual attention, though this number can be misleading if a district counts specialists and aides differently than a neighboring one.
- Per-pupil spending. Compare this against your state's average, not a national figure, since cost of living and local funding formulas vary enormously.
The National Center for Education Statistics is the federal source of record for enrollment, staffing, and demographic data, and it's the best place to cross-check a district's self-reported figures. Consumer sites like GreatSchools and Niche aggregate much of this into simpler grade-style scores, which is useful for a first pass, but their methodologies differ enough that a school scoring an A on one platform might land a notch lower on another. Treat both as a starting point, not a verdict, and always trace a headline grade back to the state report card that generated the underlying numbers.
Do Non-Academic Features Matter as Much as Test Scores?
Yes, often more than test scores alone in upscale markets, because sophisticated buyers assume academic baseline competence and shop on everything else. A district scoring in the 90th percentile on state tests but running an outdated gym, a thin arts program, and a forty-minute bus commute will lose out to a school scoring slightly lower academically but offering a stronger overall campus experience.
Campus safety measures top most upscale buyers' lists, and they go beyond a school's headline crime statistics. Look at how many School Resource Officers are on campus, how visitor access is controlled, and whether the district publishes discipline incident data publicly (most state report cards include this). Extracurricular depth matters just as much: a school with three competitive athletic programs, a functioning theater department, and a robotics team funded beyond a bake sale tells you something a test score can't.

Facility quality is easy to underestimate from a listing sheet. Bond measure history, the age of science labs, and whether a school has added STEM-specific classrooms in the last decade all signal whether a district reinvests in itself or coasts on reputation. Commute time factors in too, particularly in sprawling metro areas where a top-rated school fifteen minutes away beats a marginally higher-rated one forty-five minutes away, once you account for a child's actual daily experience.
Pro Tip: Parent-teacher organization fundraising totals are public in most districts and often published in PTA meeting minutes or annual reports. A PTA raising six figures a year usually means the school has funded field trips, classroom technology, and enrichment programs well beyond what the district budget alone covers. It's one of the fastest proxies for real community investment.
How Do District Budgets and Staffing Affect School Quality?
Money and experienced staff directly shape program variety and long-term stability, which is exactly why per-pupil spending and teacher credential rates deserve their own line item in your due diligence, separate from test scores. A district that spends generously but loses veteran teachers every year is a different risk profile than one that spends modestly but retains staff for decades.
| Metric | What to Look For | Where to Find It |
|---|---|---|
| Per-pupil spending | Compare against state average, not national figure | State department of education finance reports |
| Pupil-teacher ratio | Lower ratios generally support more individualized instruction | State report card or NCES |
| Percent of teachers with advanced credentials | Higher percentages often correlate with staff retention and experience | District annual report or state licensure database |
| Percent of budget on instruction vs. administration | A higher instruction share generally signals resources reaching classrooms | District budget document, usually posted publicly |
Budget reports and salary schedules are almost always posted on a district's own website, typically under a "business services" or "finance" tab, and most states require this disclosure by law. The single biggest mistake buyers make here is reading one year's numbers in isolation. A budget spike often reflects a one-time bond measure or a grant, not a sustained funding shift.
Pro Tip: Pull three to five years of budget data instead of the most recent year alone. A district with steady, gradual increases in instructional spending is a far safer long-term bet than one with a single inflated year followed by cuts, even if that one year looks impressive on paper.
What Boundary and Enrollment Risks Should Buyers Watch For?
Boundary changes and enrollment pressure rank among the least visible but most damaging risks for buyers near a district's edge. A property can sit inside a top-rated attendance zone today and get redistricted out of it within a single school board cycle, and that shift can happen with far less public warning than most buyers expect.
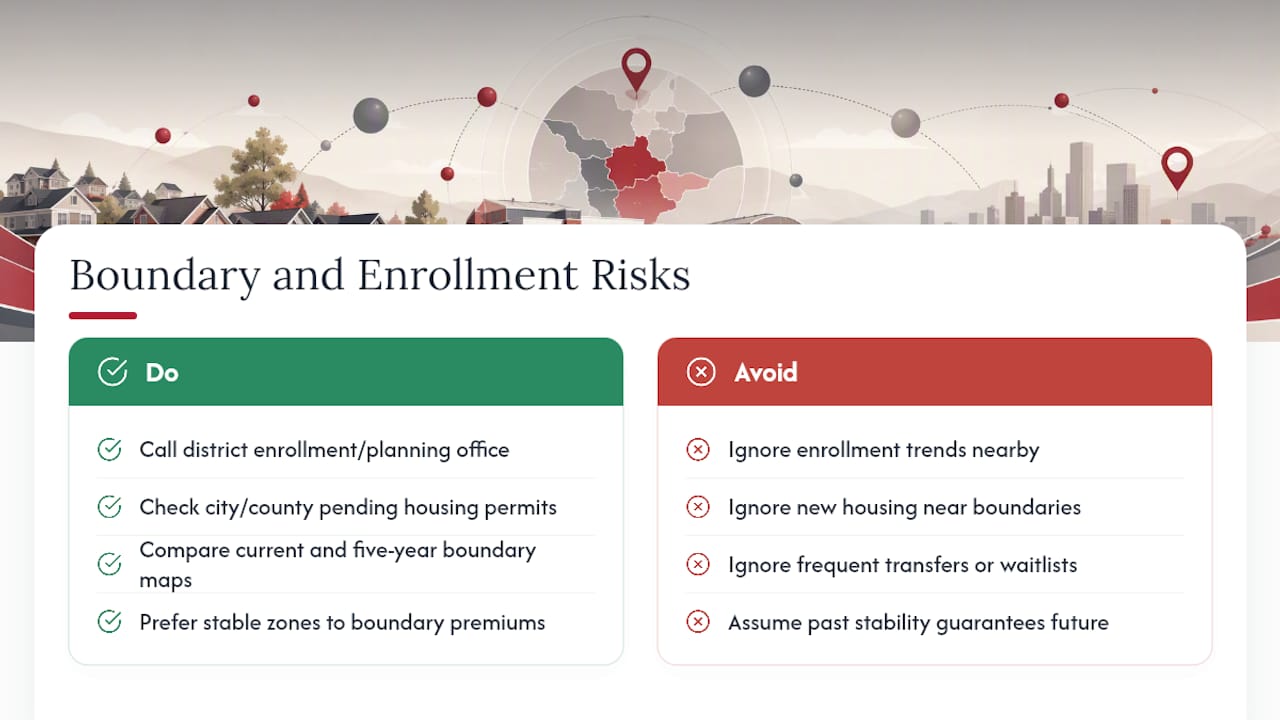
Watch for a handful of red flags before you commit. Shrinking enrollment at a neighboring school inside the same district often precedes a boundary adjustment designed to rebalance capacity. New housing developments breaking ground near a boundary line frequently trigger redistricting conversations, since districts have to absorb the added student population somewhere. Frequent emergency transfers or waitlist announcements at a specific campus suggest capacity strain that a board will eventually need to address, usually by redrawing lines. And a district with a documented history of redistricting in the last decade is simply more likely to do it again than one that hasn't touched its boundaries in twenty years.
The practical steps here aren't complicated, just easy to skip. Call the district's enrollment or planning office directly and ask whether any boundary studies are underway or scheduled, since this information often isn't posted publicly until a vote is imminent. Check your city or county planning department for pending housing permits near the boundary line you're considering. And pull the district's current boundary map alongside its map from five years ago; most districts archive these, and a side-by-side comparison tells you how volatile that specific zone has actually been. This is precisely the kind of boundary-edge arbitrage that sophisticated investors watch for, buying just inside a stable, undervalued zone rather than paying peak premium for a boundary line that could move against them.
How Do Charter and Private Schools Affect District Reputation?
A strong charter and private school ecosystem nearby usually increases competition for homes in the public district, but it also changes who actually attends the public schools and how you should read their ratings. This is one of the more counterintuitive dynamics in upscale markets, and it trips up plenty of otherwise careful buyers.
Charter schools tend to draw highly engaged families who actively research and choose their child's school, which can concentrate that engagement away from the traditional public option. Magnet programs generally work in the opposite direction, often boosting a public district's overall reputation by attracting academically strong students into specialized tracks within the same system. Private schools serve a different function entirely in high-income areas: they give some families an alternative that removes them from the public school ratings pool altogether, which can quietly skew a public school's data since the families opting out aren't a random cross-section of the neighborhood.
Before assuming a district's rating tells the full story, check these local specifics:
- Recent charter school approvals or denials in the area, which signal how the local board views alternative options.
- Transfer rules and how easy it is for families to move between public schools within the same district.
- Magnet program enrollment procedures and whether admission is lottery-based or merit-based.
- The percentage of local families using private school options, which some districts and demographic surveys track.
How Should Buyers and Investors Verify Listing Claims About Schools?
Follow a verification sequence before taking any listing agent's word for a district's quality: quick online checks first, then local confirmation on the ground. Skipping straight to a campus visit without the data behind you wastes time; skipping the campus visit entirely means you never catch what the numbers can't show.
- Pull the state report card for the exact school, not just the district, since district-wide averages can mask a weak individual campus zoned to the property you're considering.
- Cross-check NCES data on enrollment and staffing trends to confirm the district's self-reported figures match federal records.
- Compare GreatSchools and Niche scores side by side, noting where they diverge and why, since methodology differences can flag areas worth a closer look.
- Review the district's per-pupil budget report for at least three years to spot spending trends versus one-time spikes.
- Study the current boundary map using a tool like the GreatSchools boundaries map and compare it against archived versions.
- Read the school's most recent improvement plan, usually posted on the school or district website, which often flags known weaknesses before they show up in test scores.
- Walk the campus in person, ideally during school hours, to observe facility condition, security protocols, and general energy on site.
During a campus visit or a call with district administrators, useful questions include: What's driven any enrollment changes over the last three years? Has the board discussed or voted on any boundary adjustments recently? What percentage of the budget goes toward instructional staff versus administration? And for parent leaders specifically: how would you describe PTA fundraising trends, and what have those funds gone toward in the last two years?
Should You Weight These Factors Differently as a Family vs. an Investor?
Families should prioritize program fit and long-term stability, while investors should weigh liquidity, appreciation potential, and downside risk more heavily. Both groups care about the same underlying data, but the priority order changes what matters most when a trade-off appears.
Family buyer priorities:
- Program fit for your specific child's interests (arts, STEM, athletics) over headline test scores alone.
- Multi-year staffing stability, since constant teacher turnover disrupts continuity for kids already enrolled.
- Commute time and daily logistics, which affect quality of life far more than a marginal ranking difference.
- Community engagement level, since active PTAs and parent networks often shape a child's day-to-day experience.
Investor priorities:
- Boundary stability and redistricting risk, quantified by checking historical boundary changes over the past decade.
- Enrollment trend direction, since a district with declining enrollment faces future funding and consolidation pressure.
- Price premium sustainability, meaning whether the current gap between this district and comparable ones reflects a durable advantage or a temporary rating spike.
- Local housing supply pipeline, since new construction near a boundary can shift both enrollment pressure and, eventually, the boundary itself.
A practical trade-off example: a family might happily pay full premium for a home zoned to a school with a beloved but under-the-radar arts program, even if its test scores sit slightly below a rival district's. An investor evaluating the same property needs to quantify how sensitive that premium is to a boundary shift, an enrollment decline, or a new competing development two miles away, since resale value depends on the next buyer sharing that same enthusiasm five or ten years out.
What Do the Numbers Actually Say About School-Driven Price Premiums?
The clearest, most directly relevant findings suggest school-driven price premiums fall within a reasonable range, with faster sales as a consistent secondary effect across nearly every study. That range gives investors a defensible band to underwrite against, rather than relying on a single headline number that might reflect an outlier market.
| Source | Metric Measured | Market or Sample |
|---|---|---|
| Realtor | 26% more online views, 8 days faster sale | National median comparison |
| Alpharetta study | a significant premium | Alpharetta, Georgia, controlled for structural features |
| Opendoor | 10%–20% average premium, higher in some local markets | Multiple U.S. markets |
For underwriting purposes, treat the lower end of that range as your conservative baseline rather than the highest figure any single market reported. When a listing agent quotes a "premium" figure well above 20%, ask what it's benchmarked against, since headline numbers sometimes compare a top-tier district against a genuinely weak one rather than against a realistic alternative in the same price bracket.
A Practitioner's View on Verifying School Quality Before You Buy
I treat school-district analysis as a non-negotiable part of due diligence on nearly every family purchase I handle, and increasingly on investor deals too, because the data consistently backs up what clients sense intuitively: the school zone is doing more work in that price tag than almost any other single factor.
One pattern I've seen repeatedly involves buyers who fall in love with a property before checking whether it sits near a boundary edge. In one case, a family nearly moved forward on a home that looked, by every online tool, to be zoned into a highly regarded school. A direct call to the district's enrollment office revealed a boundary study already underway, one that would have shifted that exact block into a different, lower-rated zone within two years. That single phone call, which took under fifteen minutes, likely saved them a meaningful chunk of resale value down the line.
That's the layer sophisticated buyers and investors consistently underweight, and it's exactly where local market knowledge earns its keep.
How Stu Harvey Estates Helps You Confirm District Quality Before You Buy
Stu Harvey Estates gives you what a national listings site can't: direct, on-the-ground verification of school-district claims before you commit to a competitive upscale market. Rather than piecing together GreatSchools scores and state report cards on your own, you get local knowledge already built into the property search.

That means property searches that flag boundary-edge risk before you fall for a listing, direct outreach to district contacts when a claim needs confirming, and negotiation support grounded in real data rather than a seller's marketing copy. Specific services include:
- Property search filtered by verified school-district access, not just a listing's advertised zoning.
- Boundary-risk assessment for homes near attendance-zone edges in markets like La Jolla, Rancho Santa Fe, and Newport Beach.
- Local neighborhood intel drawn from more than 15 years of transactions across Southern California's luxury corridors.
- Negotiation support that accounts for school-driven price premiums when structuring an offer.
If you're ready to start narrowing down properties with school-district due diligence already built into the process, browse current available listings and reach out to start a search tailored to your priorities.
Where to Look Next for Verified School Data
Start with the National Center for Education Statistics and your state's own department of education report card, since both sit closest to the primary source and carry the least methodology drift. From there, layer in consumer tools for a broader cross-check.
- State department of education report cards: the authoritative source for test scores, graduation rates, and AP/IB participation.
- GreatSchools: useful for quick ratings and its boundary map tool, best paired with a state report card cross-check.
- Niche: helpful as a secondary cross-check on neighborhood and school-level summaries, though its methodology differs from state and federal sources.
- District budget pages: the primary source for per-pupil spending, staffing credentials, and multi-year financial trends.
- Local planning departments: essential for spotting new housing permits near boundary lines before they trigger redistricting.
Academic and financial metrics belong to NCES and state report cards first. Operational and community-level signals, like boundary risk and enrollment pressure, require direct contact with district planning offices and a firsthand understanding of local market knowledge that no single database fully captures.
This article is general information, not a substitute for advice from a qualified financial advisor. Consult a qualified financial professional about your own circumstances before acting on anything here.
Sources
- Realtor
- School quality capitalization in suburban housing markets: Evidence from Alpharetta, Georgia
- How school ratings impact home prices — Opendoor
- Affluent neighborhood persistence and change in U.S. cities — PMC